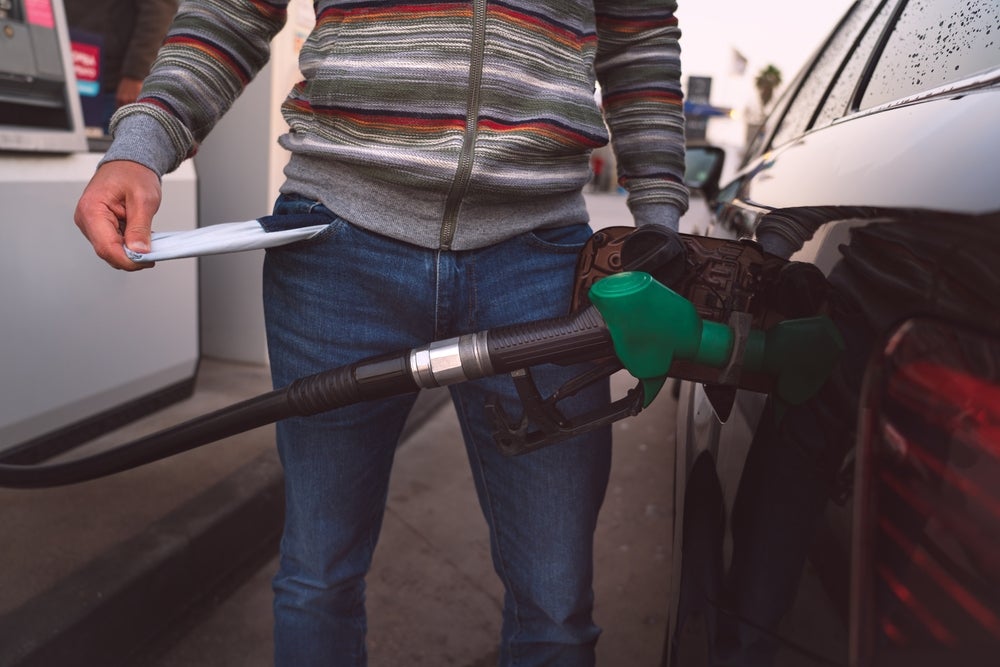
Drivers in Greece have the highest fuel bills in Europe, spending 13.13% of their income on fuel each year, according to data compiled by the financial services portal Confused.com.
The study revealed that motorists in Greece spend €1,153.26 per year on fuel, on average, which is the greatest percentage of all European countries analysed.
Go deeper with GlobalData

Access deeper industry intelligence
Experience unmatched clarity with a single platform that combines unique data, AI, and human expertise.
The price per litre of fuel in Greece (€2.40) is the third highest in Europe. This is only cheaper than Finland (€2.53 per litre) and the Netherlands (€2.48 per litre). However, when looking only at their annual fuel expenditure, Greek drivers’ bills are the fourth lowest in Europe (€1,153.26).
Following behind Greece is Portugal, with drivers predicted to spend almost a tenth (9.79%) of their income on fuel per year. In comparison, it’s 4.38 percentage points more than what neighbouring Spanish drivers spend (5.41% of income on fuel). Portuguese motorists pay €2.15 per litre for refuelling – a total annual fuel expenditure of €1,057.07 on average. This is 8.3% less than Greece in first place.
The United Kingdom ranks third, with drivers expected to spend 8.21% of their salary each year to fill their tanks. The annual fuel bill for British drivers is the third highest in Europe, averaging €1761.96. A litre of fuel costs approximately €2.16 in the UK (the same as Sweden), although cheaper than in Greece (€2.15) and the Netherlands (€2.48).
Drivers in Luxembourg spend the least income on fuel
With only 3.76% of annual income spent on fuel, Luxembourg has the best fuel economy of all countries analysed. Boasting the cheapest fuel price per litre in Europe at €1.90, the total annual fuel bill for drivers in the Alpine country is €1423.82.
Confused.com says its study - which uncovers the European countries where drivers spend the highest percentage of their yearly income on fuel - was calculated by analysing official data on each country’s average yearly income in comparison to their average fuel consumption and fuel prices per litre.
Methodology
- Confused.com sought to investigate how much income drivers from European countries spent on fuel each year.
- For every European country analysed, the values for fuel consumption per 100km of new registered vehicles. This was obtained from the International Council on Clean Transportation (ICCT) for newly registered vehicles in 2019.
- The average yearly distance travelled for a passenger vehicle in each European country was calculated. Utilising figures on total annual passenger-kilometres, registered passenger vehicle stocks from the European Commission, and vehicle occupancy rate from the EU Joint Research Centre.
- Subsequently, the estimated yearly fuel consumption in each country was determined from the annual distance travelled and fuel consumption per 100km.
- Figures for the fuel price per litre within each European country were then obtained from Auto Traveler, and the total estimated yearly fuel expenditure for a passenger vehicle in each country was calculated.
- Using Eurostat’s figures for median (after tax) income, the estimated percentage of yearly income spent on fuel expenditure was calculated for each country.
- Finally, the percentage of yearly income spend on fuel expenditure was ranked in descending order. The results reveal the countries that spend the most on fuel each year.
- Data was collected on 04/07/2022 and is accurate as of then.